Real-World Analysis for Real-World Problems
In one year, you can earn a master’s degree that positions you for a lifetime of career opportunities. You will be among some of the first graduates with specialized training combining social-science ideas and findings with computational and statistical tools and methods to provide better solutions to real-world, human-based problems.
Curriculum Overview
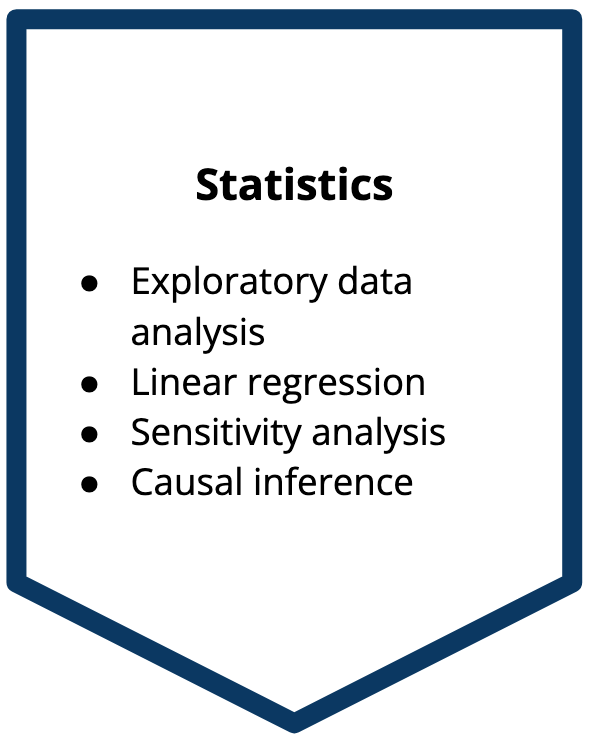
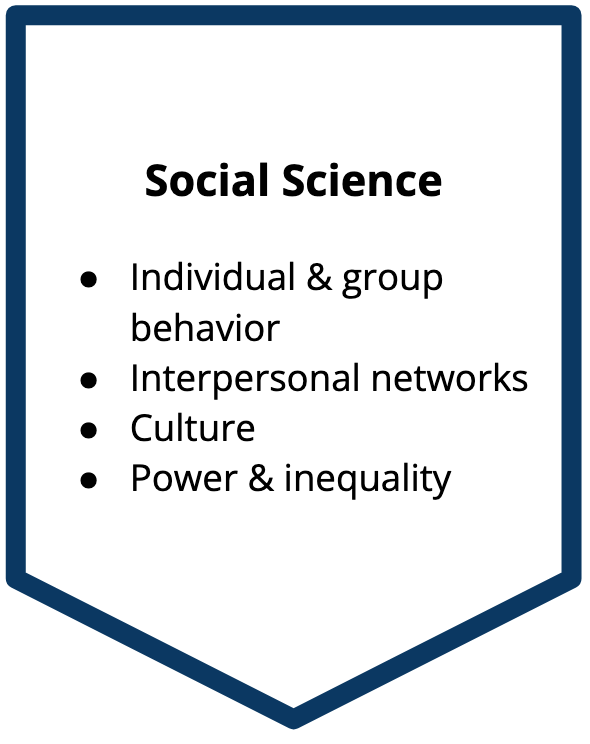
The MaCSS curriculum integrates three components: computing tools and techniques, statistical approaches to data analysis, and social-science theories and findings. This structure will provide students with rigorous training in statistical and computational methods supported by a deep understanding of people, communities, and whole societies. The structure will also emphasize real-world applications of this knowledge.
Capstone Project
Students will work in small groups on a capstone project, analyzing data from one of our partner organizations. The capstone provides students with an opportunity to apply their coursework to a current real-world problem and hone their collaborative and leadership skills in preparation for their job search.
Summer Semester – 6 units
MaCSS students need computing skills and proficiency in applied statistics to be successful in the program. Students who need additional training in applied statistics and computing can prepare for the program through our online summer semester. All students are required to take the summer semester; however, students can waive out of this requirement by passing MaCSS waiver exams in statistics and computing methods in May.
Fall Semester – 14 units
Spring Semester – 14 units
D-Lab Workshops
D-Lab provides awesome workshops in Python, SQL, and Excel for MaCSS students
The D-Lab at UC Berkeley offers a variety of workshops to help MaCSS students with these essential tools. Here are some highlights:
Python:
- Python Data Wrangling and Manipulation with Pandas: Learn how to use the powerful Pandas library to efficiently clean, transform, and analyze your data.
- Python Web APIs: Extract data from the web using APIs (Application Programming Interfaces) and learn how to interact with popular platforms like Reddit.
SQL:
- SQL Fundamentals: Master the fundamentals of SQL, the language for communicating with databases, and learn how to query, manipulate, and analyze data.
- SQL for Social Scientists: Explore SQL techniques specifically tailored for social science research, including data management, analysis, and visualization.
Excel: